
Data
Excel and Dashboard Reporting Services: Turn Spreadsheets Into Decisions
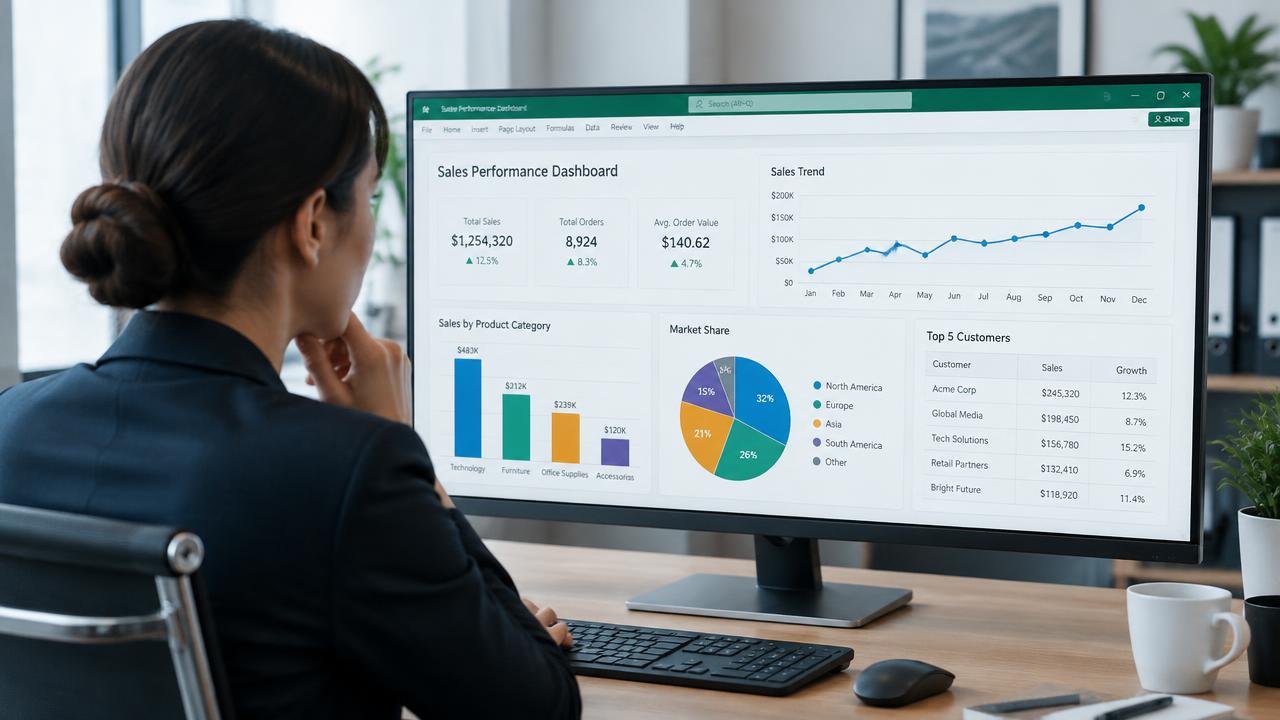
The spreadsheet problem
Most small businesses already have the data they need. It is scattered across exports, invoices and half-finished spreadsheets that only one person understands.
Dashboard reporting services pull that data into one reliable view, so the owner can answer “how are we doing?” in two minutes rather than two hours.
What a useful dashboard shows
Five to eight numbers, not fifty. Typically revenue against target, top products or services, costs, cash position, pipeline or bookings, and one or two operational measures such as delivery time or refund rate.
Every number should come with a trend — this week versus last, this month versus the same month last year.

Excel, Google Sheets or a BI tool?
For most small businesses, a well-built spreadsheet is enough and costs nothing extra. Tools like Looker Studio or Power BI make sense when data comes from several systems or several people need access.
Start simple; upgrade when the spreadsheet becomes the bottleneck.
Keep it reliable
Document where every number comes from, lock formulas, and schedule a regular refresh. A dashboard nobody trusts is worse than none at all.
Getting started
Nexa VA builds and maintains reporting in Excel, Google Sheets and Looker Studio, with data projects from $320 and ongoing weekly reporting inside monthly plans.
Need a hand putting this into practice?
Nexa VA provides tailored executive assistance, writing, and data support — shaped around the way your business works.
Let's discuss how Nexa VA can support your business